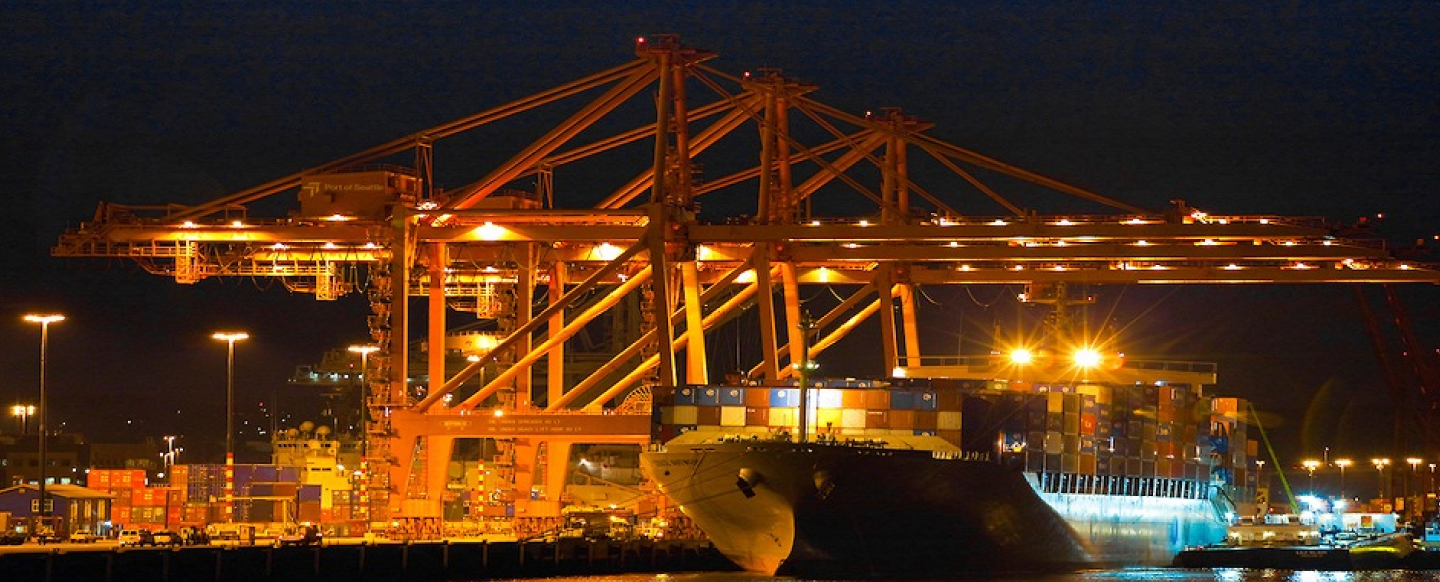
Chocolate (1806)
The section includes:
Global Import Trend
|
Year |
Import Value (USD Thousand) |
Growth Rate (%) |
|
2013 |
25,945,067 |
|
|
2014 |
27,740,413 |
6.92% |
|
2015 |
25,588,904 |
-7.76% |
|
2016 |
26,290,014 |
2.74% |
|
2017 |
27,275,833 |
3.75% |
|
2018 |
28,936,011 |
6.09% |
|
2019 |
29,353,648 |
1.44% |
|
2020 |
28,668,058 |
-2.34% |
|
2021 |
32,334,923 |
12.79% |
|
2022 |
33,491,344 |
3.58% |
*Trade Map (https://www.trademap.org/)
Top Importing Countries
|
Country |
Imported value in 2022 (USD Thousand) |
Imported value in 2013 (USD Thousand) |
Growth Rate (%) |
|
Country |
Imported value in 2022 (USD Thousand) |
Imported value in 2013 (USD Thousand) |
Growth Rate (%) |
|
United States of America |
3,833,861 |
2,167,170 |
76.91% |
|
Italy |
666,082 |
595,043 |
11.94% |
|
United Kingdom |
2,671,795 |
1,905,383 |
40.22% |
|
Russian Federation |
617,813 |
778,988 |
-20.69% |
|
Germany |
2,477,543 |
2,223,401 |
11.43% |
|
China |
575,468 |
352,370 |
63.31% |
|
France |
2,410,216 |
1,909,595 |
26.22% |
|
United Arab Emirates |
549,326 |
337,696 |
62.67% |
|
Netherlands |
1,588,694 |
1,095,731 |
44.99% |
|
Saudi Arabia |
532,095 |
538,123 |
-1.12% |
|
Canada |
1,243,237 |
912,691 |
36.22% |
|
Austria |
500,243 |
532,986 |
-6.14% |
|
Poland |
1,072,192 |
574,509 |
86.63% |
|
Sweden |
483,150 |
375,879 |
28.54% |
|
Belgium |
1,067,212 |
733,619 |
45.47% |
|
Czech Republic |
471,600 |
379,740 |
24.19% |
|
Japan |
726,026 |
614,834 |
18.08% |
|
Australia |
442,307 |
443,727 |
-0.32% |
|
Spain |
725,203 |
607,947 |
19.29% |
|
Romania |
424,244 |
187,792 |
125.91% |
*Trade Map (https://www.trademap.org/)
Top Exporting Countries
|
Country |
Exported value in 2022 (USD Thousand) |
Exported value in 2013 (USD Thousand) |
Growth Rate (%) |
|
Country |
Exported value in 2022 (USD Thousand) |
Exported value in 2013 (USD Thousand) |
Growth Rate (%) |
|
Germany |
5,421,762 |
4454346 |
21.72% |
|
Türkiye |
841,811 |
545,043 |
54.45% |
|
Belgium |
3,324,238 |
2716574 |
22.37% |
|
Mexico |
663,731 |
598,437 |
10.91% |
|
Italy |
2,441,325 |
1608346 |
51.79% |
|
Spain |
649,041 |
426,363 |
52.23% |
|
Poland |
2,356,913 |
1414054 |
66.68% |
|
Russian Federation |
594,063 |
666,761 |
-10.90% |
|
Netherlands |
2,247,735 |
1847694 |
21.65% |
|
Singapore |
559,944 |
411,768 |
35.99% |
|
Canada |
1,971,723 |
1070357 |
84.21% |
|
Austria |
537,875 |
512,366 |
4.98% |
|
United States of America |
1,735,085 |
1544428 |
12.34% |
|
United Arab Emirates |
494,959 |
396,320 |
24.89% |
|
France |
1,449,238 |
1551387 |
-6.58% |
|
Sweden |
466,042 |
344,714 |
35.20% |
|
United Kingdom |
1,009,839 |
894107 |
12.94% |
|
China |
402,682 |
268,792 |
49.81% |
|
Switzerland |
882,155 |
822291 |
7.28% |
|
Malaysia |
367,164 |
165,766 |
121.50% |
*Trade Map (https://www.trademap.org/)
Import Trend of Bangladesh
|
Year |
Import Value (USD Thousand) |
Growth Rate (%) |
|
2015 |
5,240 |
|
|
2016 |
11,671 |
122.73% |
|
2017 |
14,154 |
21.27% |
|
2018 |
11,269 |
-20.38% |
|
2019 |
10,460 |
-7.18% |
|
2020 |
8,728 |
-16.56% |
|
2021 |
14,636 |
67.69% |
|
2022 |
17,721 |
21.08% |
*Trade Map (https://www.trademap.org/)
Top Exporters of Bangladesh
|
Exporters |
Imported Value in FY 22-23 (USD Thousand) |
|
India |
1,093 |
|
Netherlands |
730 |
|
United Arab Emirates |
648 |
|
China |
591 |
|
Malaysia |
493 |
|
Singapore |
407 |
|
Indonesia |
313 |
|
Türkiye |
278 |
|
Denmark |
202 |
|
Oman |
95 |
*Trade Map (https://www.trademap.org/)
